
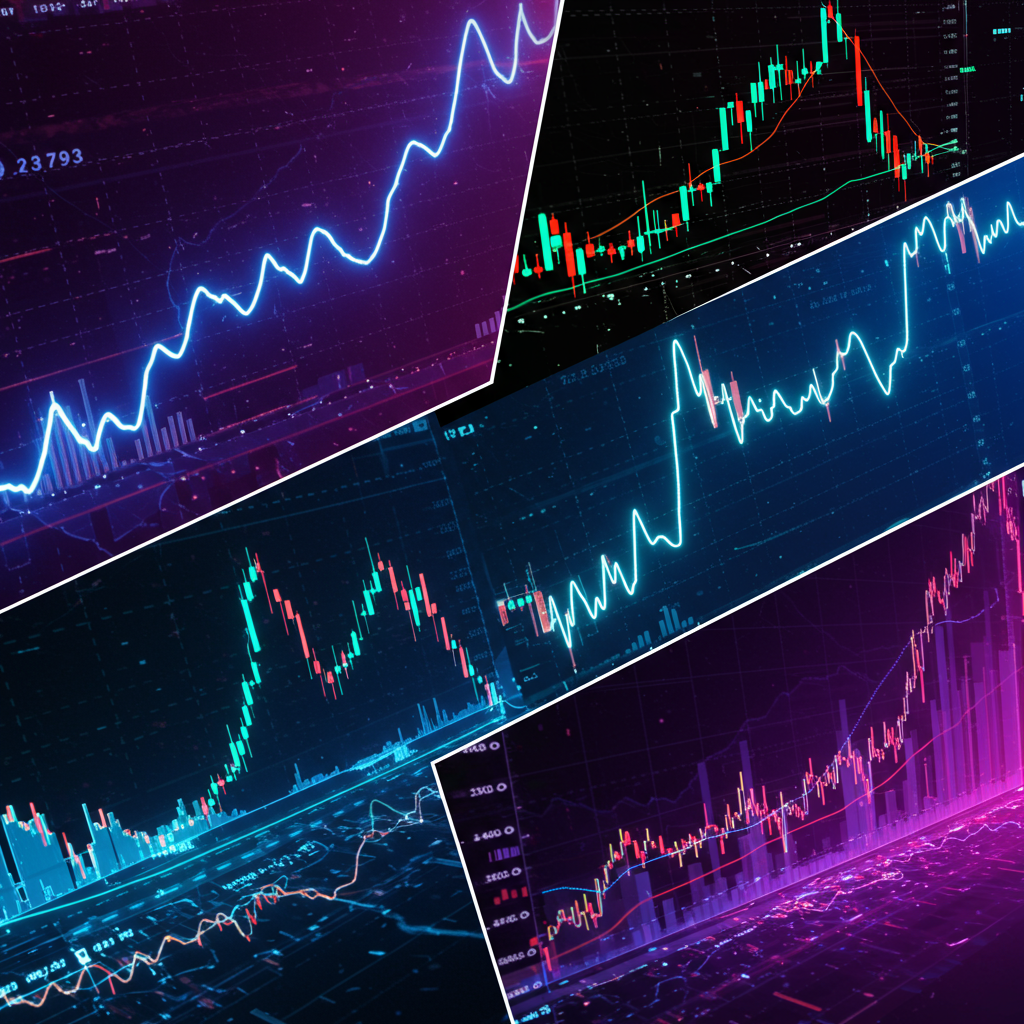
Technical Indicators Toolkit: MA, RSI, MACD & Bollinger Bands
What are Technical Indicators?
Technical indicators are tools used in trading. They help traders understand price movements. Traders use these indicators to make better decisions.
Why Use Technical Indicators?
Technical indicators can help you predict future price changes. They use past price data to find patterns. This can help you buy or sell at the right time.
Types of Technical Indicators
There are many types of technical indicators. Here are four popular ones:
- Moving Average (MA)
- Relative Strength Index (RSI)
- Moving Average Convergence Divergence (MACD)
- Bollinger Bands
Moving Average (MA)
The Moving Average is a simple indicator. It shows the average price of a stock over a certain time. Traders use it to see if a stock is going up or down.
How to Use MA
To use MA, you need to choose a time frame. Common time frames are 10 days, 50 days, or 200 days. A shorter time frame shows quick changes. A longer time frame shows the overall trend.
Relative Strength Index (RSI)
The Relative Strength Index (RSI) measures how fast a stock is moving. It ranges from 0 to 100. A high RSI means a stock may be overbought. A low RSI means it may be oversold.
How to Use RSI
Traders often look for RSI levels above 70 or below 30. An RSI above 70 may mean it’s time to sell. An RSI below 30 may mean it’s time to buy.
Moving Average Convergence Divergence (MACD)
The MACD is a more complex indicator. It shows the relationship between two moving averages. Traders use it to find buy and sell signals.
How to Use MACD
When the MACD line crosses above the signal line, it may be a buy signal. When it crosses below, it may be a sell signal. This helps traders make quick decisions.
Bollinger Bands
Bollinger Bands consist of three lines. The middle line is a simple moving average. The upper and lower bands show how much the price can change.
How to Use Bollinger Bands
When the price touches the upper band, it may be overbought. When it touches the lower band, it may be oversold. Traders watch these bands to find trading opportunities.
Comparison of Technical Indicators
| Indicator | Type | Best for |
|---|---|---|
| Moving Average (MA) | Trend Indicator | Identifying trends |
| Relative Strength Index (RSI) | Momentum Indicator | Finding overbought or oversold conditions |
| MACD | Trend and Momentum Indicator | Buy and sell signals |
| Bollinger Bands | Volatility Indicator | Price extremes |
How to Choose the Right Indicator
Choosing the right indicator depends on your trading style. Some traders prefer simple indicators like MA. Others like more complex ones like MACD.
It’s good to use more than one indicator. This can give you a better picture of the market. Combining indicators can help confirm your trading decisions.
Practice Makes Perfect
Using technical indicators takes practice. Start by using them on paper first. This way, you can learn without risking real money.
Once you feel comfortable, you can start trading with real money. Remember to keep learning and improving your skills.
FAQ
What is the best technical indicator for beginners?
The Moving Average (MA) is great for beginners. It is simple and helps identify trends.
Can I use multiple indicators at the same time?
Yes, using multiple indicators can give you better insights. They can confirm each other’s signals.
How often should I check my indicators?
It depends on your trading style. Day traders check indicators often. Long-term traders may check them less frequently.
Technical indicators help traders make smart decisions. Use them wisely to improve your trading skills.